Insight Paper May 29, 2014
Rapid Prototyping in Healthcare Analytics

A New Approach to Discovering Value
As we step into the post-ACA world, where the economic consequences, as well as the clinical value of interventions, need to be understood, the biggest missing pieces of information are usually the general pattern of resource use and the associated overall cost of care for a condition under current practice. Providers are familiar with their own individual practices, but patient care is often a composition of many providers that we hope is orchestrated. We often have information on the cost of a new intervention and its associated risks, but usually without an appreciation of the full set of costs and risks that patients already face. Detailed claims data, summarized over an appropriate time frame and organized to show the major details of practice, provide an easily accessible resource to appreciate the ordinary economics of a therapeutic area and identify drivers of resource use, both fixed and variable. Decision models to recommend the best course of treatment may still be distant goals, but without a basic understanding of the types and rates of resource use and the complications and risks of care, we will make no progress.
Even now, such analyses are carried out over many months, or in some cases even years. When healthcare analytics were limited to researchers in medical specialties, often university-based, these timelines were tolerable. But, when dealing with the many dimensions of population health, such timelines are unacceptable. We do not have the luxury of one-of-a-kind analyses.
While every therapeutic area has unique details, the overall structure of the delivery of medical care has a fairly small number of components and a standardized nomenclature. Claims data detail the delivery of care by date, location (hospital inpatient and outpatient, office, home, etc.), type (diagnostic and therapeutic procedures) and reason (diagnoses both primary and secondary). Having selected a particular population, summarizing the types of resource use over time, with attention to rates of use and characterizing resource use as primary disease management, complications of care and coincidental care (people with heart disease still get their teeth cleaned), we can uncover a first level appreciation of the care of a patient population of interest and begin to understand how the possible value represented by a new intervention can be assessed in reference to their placement within existing patterns of care.
Since the basic types of resource utilization are fairly consistent and can be constructed of individual events, creation of analytic structures to assess value have a number of standard features, yielding the possibility of efficiency of design to create an initial view that shows the main features of a type of disease management. This also allows for the identification of those situations that are outside the norm for further investigation. Treatments that are of greater value can be identified in summary by showing longer survival and lower cost of care, but can also be understood in lower rates of relapse, shorter duration of treatment and lower rates of ordinary complications. Tying value to the structure of care delivery makes the value more apparent and allows for an appreciation of competing risks and benefits.
Just as any house has a fundamental set of characteristics that define it and are used to compare houses (walls, roof, windows, doors, foundation, etc.), so too the analysis of therapeutic areas has a basic set of characteristics that need to be specified and whose enumeration lets us know that we have adequately defined an analysis plan. And just as two houses can vary greatly in size, features and cost, so too can different analysis plans. And while custom construction can deliver a larger set of benefits, it does this with greater complexity and cost. Sufficient, standard designs can perform well and have greater efficiencies.
In the past, health economic analyses were conducted in a boutique fashion with everything custom designed. This is adequate if a single therapeutic area has great value (as it could for a drug or medical device manufacturer). However, if we are to show greater value across the spectrum of healthcare delivery, standardized rapid prototyping for the analysis of value is needed and achievable.
An important complexity in past work on study design was the description of clinical details and categories that would then be translated into the coding language of claims data. While substantial progress can be made working with coding indices, these efforts are often limited by failures of imagination. Depending on which terms are searched, significant codes can be missed and insignificant codes included. This leads to the inevitable limitation that the researchers don’t know the effect of things they did not include.
There is a different approach, systematic review, that allows the data itself (generated by the clinicians caring for patients) to show which conditions and interventions are used and with what frequency. By using the data to direct part of the study construction, the perennial limitation of “not knowing what we did not include” can be over overcome. Since the preliminary analyses can show everything in the data, we can choose those factors that are both relevant and have high enough frequency to make a difference. We are still left with the limitation of not knowing what was not recorded, but most of the things that can affect patients and that we do to patients are recorded. We often have limited resolution – we know of a condition but perhaps not its severity, but it is unlikely that most of the significant information would not be present at all.
While systematic review is a key step in data directed analysis, we can use other aspects of data science (the study of the generalizable extraction of knowledge from data) to aid in the creation of data views that can help us more efficiently explore the many dimensions of health and healthcare delivery that we will need to begin the process of improving care and outcomes.
In the next sections we will examine the steps needed to rapid prototype in a given therapeutic area and to look at the direct data science alignment within an organization required for success. Following this cohort construction map, we will apply it directly to a specific case, an examination of outcomes and resource use of Medicare beneficiaries with acute myeloid leukemia.
Cohort Construction a 12-step program
The overall methodology for construction of rapid development cohort is shown in Table 1 below. Each step in the process involves the participation of at least one type of team member but may require several to coordinate decision-making based on information revealed in the intermediate steps in the process. While a simple paid claims historical database is assumed here, other data types follow the same general steps.
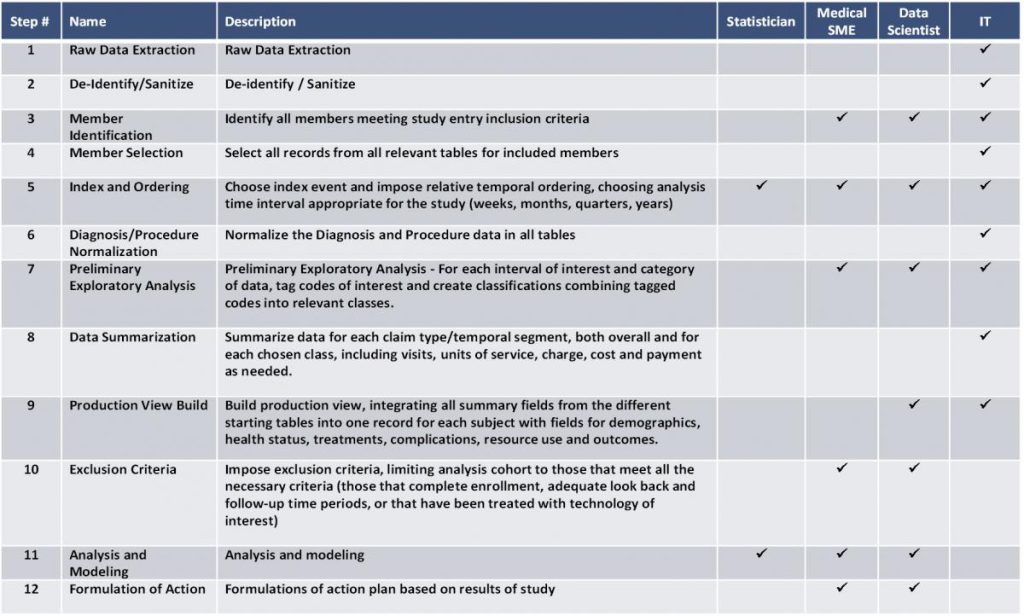
Analysis Cohort Construction Methodology
The first step is simply the ability to access and extract raw claims data from the information technology (IT) infrastructure of the organization. Closely related is the next step of being able to de-identify and sanitize the data. It is unlikely that all steps in the process can take place within the controlled environment of the IT organization, and so, fields that contain patient identifiable information such as member number, name, and ssn need to be either removed from the tables or replaced by a foreign key that can still be used to link records for the same person but protect patient confidentiality.
Existing data studies, such as described here, rely extensively on the design of prospective clinical trials used to test the utility of new medical treatments. This is both recognition of the value of the design elements in these trials and also the utility of maintaining familiar vocabulary when dealing with subject matter experts (SME). With this team component in mind, the next step (step 3) is to specify the inclusion criteria for the study. This is the demographic, diagnostic or treatment characteristic or characteristics that everyone in the study shares providing the frame of reference for using the study results. While the inclusion criteria will need to be used by IT in performing the initial extraction, the specification of the criteria will most often require input from SMEs, the coordinating data scientist (DS) and IT.
Once the set of all members that met the inclusion criteria has been assembled, IT would next (step 4) select all records for the inclusion cohort from all relevant data tables. This set of extracts will form the core of the analysis. In the remaining steps, data science will be used to organize the information in the data to enable the extraction of knowledge.
The next step (step 5) is the first to begin imposing structure onto the data. There is in any analysis an index event. It is often the date of the first occurrence of a particular condition or the date of a specific intervention such as a surgery. In some studies the index date is simply the first day of the year or some other specific date. Its specification allows all other information to be placed in the constructed views relative to that event. At the same time, it is useful to choose the analytic time interval. While in principal every date of service could be maintained, grouping the date stream greatly simplifies construction of the production view and facilitates many of the questions commonly asked such as: six-month survival; ninety-day readmission; and one-year cost. This is the first point where all members of the design team should be included with the statistician (ST) contributing to understanding of the implications of the chosen time frames on different modeling choices. It is important that this step occurs before the next one since the categories of interest in the diagnosis and procedure data that are surprising or expected often varies before an index event and after.
While each claim record will have a specific date and person, there are often a number of diagnoses and procedures that are recorded in the claim. This is convenient if you are looking at one record at a time, but for cohort construction these need to be normalized (step 6) with one record for each diagnosis or procedure. In this way, queries to examine the frequencies of different diagnoses and procedures within the time intervals of interest can be easily executed.
Following the normalization, the queries to support the preliminary exploratory analysis of the recorded diagnoses and procedures can be carried out (step 7). This is the first opportunity to extract knowledge from the data. While this analysis will include verifying that expected diagnoses and procedures, it provides the first opportunity for learning. These gross summaries for each time interval can include such information as the number of deaths, the number of hospitalizations, and the cost of care. Sets of codes for the same clinical condition can be tagged and used to create classifications to be used in later analyses. Part of the learning here is to see what events we had expected to be well documented (appropriate codes could be pre-identified) are in fact not easy to capture (chemotherapy drug codes exists but may not be used) and other conditions that were not thought of in advance could be quite common and need to be accounted for in later analyses so as not to introduce biases. Because this is a situation where new learning can have a significant impact over later design and analysis, the main team of SMEs, DS, and IT are all needed.
Armed with the insights from the preliminary exploratory analysis, the IT specialist can begin summarizing the data for each temporal segment/record type (step 8). Using the code tags and classifications decided upon in the last step, summaries for each record type are constructed, both overall and for each chosen class, in each time interval of interest. These would include such information as occurrences, visits, units of service and cost measures as needed. These summaries represent the raw material that will be used to build the production view for analysis (step 9). This is a collaborative design effort between the DS and IT. The goal is to integrate all the constructed summaries from the included table set into one record for each subject with fields for demographics, health status, treatments, complications, resource use and outcomes, summarized for each of the temporal units. This is the view of data that will be used for descriptive and predictive modeling and has been constructed to be able to address each of the questions arising from the initial design and the preliminary exploratory analysis.
While inclusion criteria were imposed at the beginning of the process of data extraction, it is only at this point that exclusion criteria are applied (step 10). This is simply because only when the analysis view has been constructed that the full set of possible exclusion criteria can be addressed. Importantly, exercising exclusion at this point also allows for an assessment of the bias created by the exclusion criteria and examination of the overall rate of utilization of specific excluding events. Examples of those that could be excluded from analysis include: lack of continuous enrollment; inadequate look back and followup periods; or those that had a specific event or technology used in the look-back period that is outside the study design.
The next step (step 11) is the actual analysis and modeling for which the cohort was created. While this can be carried out without the inclusion of the project data scientist, it is usually good to include the data scientist in this stage, especially since one of the first things that is learned is that something else of utility has been left out. Too often it is only on doing the analysis itself that we learn that more information needed to be included.
The final step in the process (step 12) is to use the learning from the analysis for such ends as improved care delivery, enhanced communication of value, or to reformulate the next round of analysis to better target the original study goals.
Case Study – Acute Myeloid Leukemia
To illustrate the rapid prototyping approach in a real world example we constructed a prototypical cohort of patients with Acute Myeloid Leukemia (AML). The sample database had 2.5 million Medicare beneficiaries and consisted of all claims (hospital inpatient, hospital outpatient, skilled nursing and office visits and other providers) for the time period from 2001 through 2006. Understanding that it would be useful to have a reference look back period prior to diagnosis of AML, all claims from 2002 through 2006 were searched for any use of the ICD-9-CM codes 205.0X for acute myeloid leukemia. In this fashion, 3,803 members were identified with at least one AML claim (Step 3). Next all claims for this initial cohort were selected from the 2001 through 2006 data tables (Step 4). This resulted in a starting set of tables with 845,382 claims, averaging 37 claims per subject per year.
The chosen index event (step 5) was the first diagnosis of AML and the data was summarized by quarter in keeping with de-identification that removed the exact dates of service. The choice was made to look at the year prior to the first diagnosis of AML and the two years following the first diagnosis, summarizing for the first analysis to the level of yearly events and payments. The year prior to the diagnosis of AML will be used to assess the underlying co-morbid burden that subjects have in addition to AML and understand the association prior health state and survival with AML.
Having identified the index event and structured the prior period and the follow up, the next step (step 7) is to undertake a preliminary exploratory analysis. While a number of complications and comorbidities were expected (neutropenia, pneumonia, and septicemia, for example) the exploratory analysis showed that 20% of subjects had other types of lymphoma in the year prior to AML and that 60% had other lymphomas concurrent with AML during the first year with AML. While it is possible that some of these cases might represent miscoding of either AML or another lymphoma, those with AML plus another type of lymphoma had twice the one-year mortality rate, indicating that it is likely that multiple types of cancer were present at the same time. Exploratory analysis also showed that survival with AML was greatly affected by prior year health state, increasing by 40% from the first to the fourth quartile of prior year health state.
Finally, the exploratory analysis showed that it was easy to identify interactions for chemotherapy, but we were not able to quantitatively assess dosing of specific chemotherapy agents. Anemia was identified as a common comorbidity that we had not previously considered. Hospitalizations for bone marrow transplant were easy to identify and codes that indicated complications arising from transplant were also being used.
The tagged codes for the various other lymphomas and complications like pneumonia and septicemia were grouped and each quarter year was coded to reflect this information (step 8). A production view was then constructed (step 9). It was decided to focus attention on cases of AML first diagnosed in 2003 and 2004 so that there was a long enough look back time to identify the first diagnosis and be able to guarantee two years of follow up and survival information (step 10).
After excluding those whose first diagnosis of AML was not in 2003 or 2004, the study sample size was reduced to 1,767 subjects. Mortality was 49.3% at one-year post diagnosis and 60.4% at two-years post diagnosis. One-year mortality was greatly affected by other diseases influencing the subject’s health state. Those in the lowest severity quartile had 35% mortality at one year compared to 62% for those in the highest quartile. Similarly, those with no other lymphoma had half the one-year mortality as those with other lymphoma (31% vs. 62%, respectively). Combing these two factors we found a five-fold difference in one-year mortality between those in the lowest severity quartile with no other type of lymphoma (15%) compared to those in the highest severity quartile with other lymphoma (77%).
The first year with AML, costs tripled the amount as the prior year on average ($39,132 vs. $12,641), with approximately two-thirds of that associated with hospital costs ($28,062). Complications were common in the population with 30% experiencing neutropenia, 35% with pneumonia, and 27% with a urinary tract infection in the first year with AML. Altogether these complications occurred in 60% of all patients, with costs more than three times higher for those with complications compared to those without ($55,490 vs. $14,374 respectively).
Bone marrow transplant is seen as a definitive therapy in AML for those that fail initial treatment. However, for this time frame it was a fairly rare treatment being used in only 1% (20 subjects) and with all but one transplant case being in subjects with the added complication of other lymphomas. Given the very small sample size, it was not surprising that there was no survival advantage for those with transplant; and given the very high one-year mortality, there was no time for transplant to show a benefit of lower resource use in the succeeding time frame. The cost of the transplant hospitalization was very high ($119,000), and with so few subjects surviving the first and second years there is no chance for the definitive treatment of AML with transplant to show economic value.
One of the original purposes in undertaking this case study was to see if AML would be a good target population to use in an economic evaluation of bone marrow transplant (BMT). The results indicate that both because of lower use of BMT and the very high mortality rate of those that have AML, especially those with the added burden of other lymphoma, there is no time for the advantage of definitively treating the cancer to show economic value in reduced complications and obviating the need to other cancer therapy later. Other cancer types with better survival should be looked into for candidates that can more easily show economic value.