Insight Paper December 9, 2015

Visualizing data to gain understanding of how geography impacts your business
Business Driver
Whether you work in marketing, strategy, finance, technology, product development or analytics, data is likely an important driver of your work. Words like ‘big data’ or ‘data visualization’ can be intimidating to those who do not fall under roles like data architect or analyst, but it doesn’t have to be. Displaying data in a way that everyone can understand, allows for individuals beyond those with ‘data’ in their title to find actionable insights.
What Is GIS?
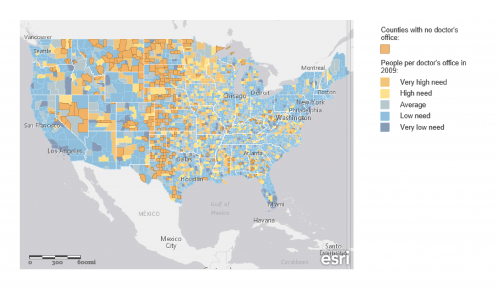
A Geographic Information System (GIS) allows a user to store, visualize and interpret data that has one requisite attribute: a geographic element. A geography is a defined area of land including countries, regions, counties, census blocks, and others as a basis for analysis. Taking a geographic lens to data allows for simple but meaningful interpretation. A majority of the population considers themselves to be visual learners, and simply put: it is much easier for a consumer of data to gage good or poor outcomes by a diverging color set than a multi-million record database.
In addition to being an easy-to-understand output of data, GIS allows for analysis that would be difficult in other forms. These data enable a GIS user to analyze trends and understand relationships, whether that be of geographies, variables, or time.
While this article focuses mostly on outputs created from geospatial data, it is important to understand basic data characteristics. Data used for GIS comes in a variety of formats from geo-enabled sources. Again, as long as a data point has some geographic reference, it can be used with GIS. This applies to numeric, vector, or raster data. The complexity of the analysis is determined by the number of ‘layers’ in the data. Layering is a key advantage to GIS; unlike other types of information studies, GIS allows a user to link data from various sources by using location as the key. A user can add numerous data layers to one geography. As data sets grow, the user is able to visualize more granularly and test the impact that certain elements have on the next.
How to Get Started Using GIS Within Your Organization
GIS should be a part of every organization’s analytic strategy. There is a significant amount of geospatial health data available to the public. Aggregating those datasets is a great first step in building a GIS database. Adding an organization’s own proprietary data can further enhance the value. For example, a payer can determine if their membership is on par with the county/state/regional average for cost, outcomes, care management, and more. Once a geo-database is established, GIS tools such as Tableau and ArcGIS can enable analysis. While Tableau can produce simple visualizations, tools like ArcGIS requires more technical expertise, as well as analysts who have an aptitude for geospatial analysis. Many organizations are setting up GIS sub-practices within their analytic teams to better understand how geography is impacting their business.
Start gaining insights by adopting your own GIS strategy today.