Insight Paper May 5, 2016
So You Want To Be A CISO – Is It Worth It?

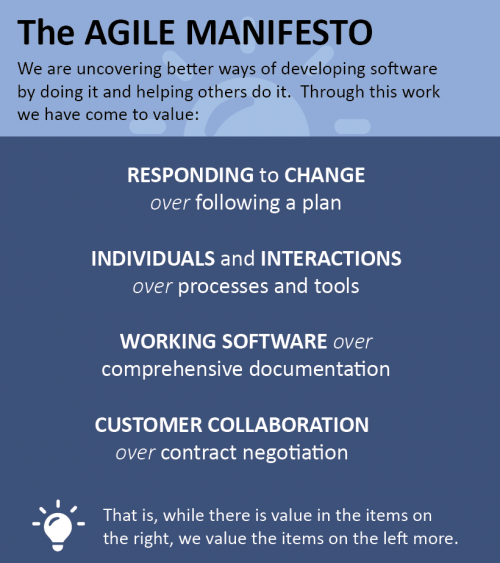
Using the Agile methodology to design useful, relevant reports
I am a late-comer to Agile. For years while at Bell Labs, MCI Systemhouse, FastWeb, and US Bank, I collected what I called “tricks” to help me and my teams get things done better and faster. Only when I went to work for ThoughtWorks did I realize that this had all been codified in a framework called Agile, which far outstripped my bag of tricks. Still, like the abandoned child raised by wolves before being brought back to civilization, some of my “wolf boy” tricks developed outside the Agile world provide a fresh perspective on the problems Agile solves.
One such trick is creating Reports in an Agile manner. In full disclosure, I fear reports. Typically the consumers of reports (often collectively called “The Business”) do not know what reports they need to run their business or, more importantly, what they will need in the future. Too often, the result is “give me everything I can think of” requirements, which then (in waterfall development) morph over the course of delivery and get extensions over the life of the reports, all resulting in bloated reports that are barely readable and containing information no one needs but everyone is afraid to delete.
Years ago, as CTO at FastWeb, I made a fortunate mistake. We were two weeks away from cutting over from our original systems to a modernized, high-capacity, and scalable environment, when we realized we had totally forgotten about the reports we delivered to the rest of the company. We quickly identified options:
- Forget about reports (not much of an option, but we really did try to convince ourselves this was possible at first!)
- Urgently reverse engineer existing reports and recreate them as-is (would have been the traditional approach, but we had zero capacity to do this because in the run-up to our game-changing migration, we were already working days, nights, and weekends)
- The option we finally chose (read on for the details)
At that time, Oracle had freshly embraced the Web, and they had a free web server with a simple, forms-based query capability. What we did, in place of reports, was deliver this page to all our internal customers (Sales, senior management, etc.) and taught them to cobble together their own requests (e.g., “How many females from the ages of 16-18 in the Western U.S. responded to offers from this particular advertiser, and how long did it take for them to do so?”).

Then we monitored usage. And monitored some more. Every time someone ran the same query a few times, we’d go talk to that person. If it was useful to them, we pushed that query into production and advertised it to others. Over the course of a week, a month, a quarter, and a year (the various periods in a company that need reports) we published all the reports needed by the company exactly the way the users needed them, without pain and with minimum overhead wasted on waterfall Requirements-Development-Testing-Acceptance.


Repeating The Experience, Successfully And Systematically
That was a one-time, accidental success on our part. However, I remembered that experience and have implemented it here at Trexin. For multiple clients, I applied the same method, updated for today’s technology and wrapped in Trexin’s Pragmatic Agile framework. It worked, every time, to the great satisfaction of the client. Here are the steps:
1. Stage the data somewhere convenient. IT no longer needs to stand up a full data warehouse with multiple pre-production environments. Leveraging the cloud, the data can be staged without impacting production data or server capacity.
2. Leverage Excel as a UI. Microsoft Excel is ubiquitous and provides a powerful and flexible User Interface (UI) at no marginal cost or learning curve for your users. Connect it to the data store you set up in Step 1.

3. Leverage Excel’s PowerPivot plug-in to make your Report(s) interactive. Reports need to be attractive and intuitively obvious to the user, and today a report needs to be interactive rather than static to support BI (business insights). Excel’s pivot tables are powerful but not attractive or easy to use. Microsoft’s free PowerPivot plug-in is, however, and again without marginal cost or learning curve for your users.
4. Involve your users as early as possible. Creating a report with static data in Excel gives the user something to react to after only a day or two. Then refreshing the data and providing PowerPivot to support what-if exploration empowers the user to use the report after a week or two. The users’ experiences drive rapid maturation of the report, until it provides the usability and business value intended. During this period, report extensions and new reports are also identified, which drives the Agile cycle of continuous delivery.


5. Deliver to IT to operationalize. At this point, the report itself serves as a mature business requirement for IT, enabling IT to operationalize efficiently. The ROI is clear, because the reports are being created manually, and the manual effort can be compared to the operationalization effort and ongoing maintenance. At this point, report extensions and new reports have already been identified, enabling IT to consider the future capacity needed.

6. Expand/explore with powerful BI tools. Excel may be sufficient for the users’ needs, but if not, this first implementation serves as a solid base for a more powerful base for powerful BI tools such as Cognos, Tableau, etc. Again, the ROI of licenses, training, and implementation is a straightforward comparison against the cruder Excel reports.

Lessons Learned
Now more than ever, the world won’t wait for “The Perfect Requirements” before implementing, and the historical track record of reports is particularly vulnerable to overblown, changing requirements. Whenever you have the chance to migrate or create new reports, keep in mind the Agile mindset above. Trexin has extensive experience “in the trenches” of Agile/Data Insights. Contact us to learn more, get more pragmatic advice on how to “get it done”, or to have challenging conversations that could lead to interesting and beneficial results.