Insight Paper June 30, 2016
Dealing With Complexity in Big Data

Hacking the Big Data black hole – a cursory overview of the paradigm
Big Data is esoteric. Maybe too esoteric. In concrete terms, Big Data refers to large data sets that are often analyzed by powerful computers to reveal patterns. Not too far off on the analytical spectrum from Big Data is machine learning—the ability of computers to learn without explicit guidance. Like its counterpart, Big Data, machine learning implies pattern recognition and, again, leveraging powerful computing capabilities. To unite Big Data and machine learning, one must consider data mining, the discovery of patterns in large data sets, implying the use of applied statistical techniques. The triad of Big Data, machine learning, and data mining is trending in 2016 and has been for a few years.
Big Data forces data scientists, business analysts, and the like to generate hypotheses, test these hypotheses, and work to deliver insights that will generate better experiences for the customer and value to the client. To begin to understand the immense impact that Big Data has had on modern society, one can start by Googling it, which will return approximately 332 million results in 0.42 seconds. This article will briefly discuss Big Data in more concrete terms, touching on the dynamic flow of data, useful platforms for examining this flow, quantitative functions that can be applied to better understand this flow, and the usefulness of variables in data visualization to help describe this flow.
To set the stage for this discussion, it is essential to first examine the following chart, which shows a common hierarchy in data science/machine learning right now:
Complexity vs. Business Value
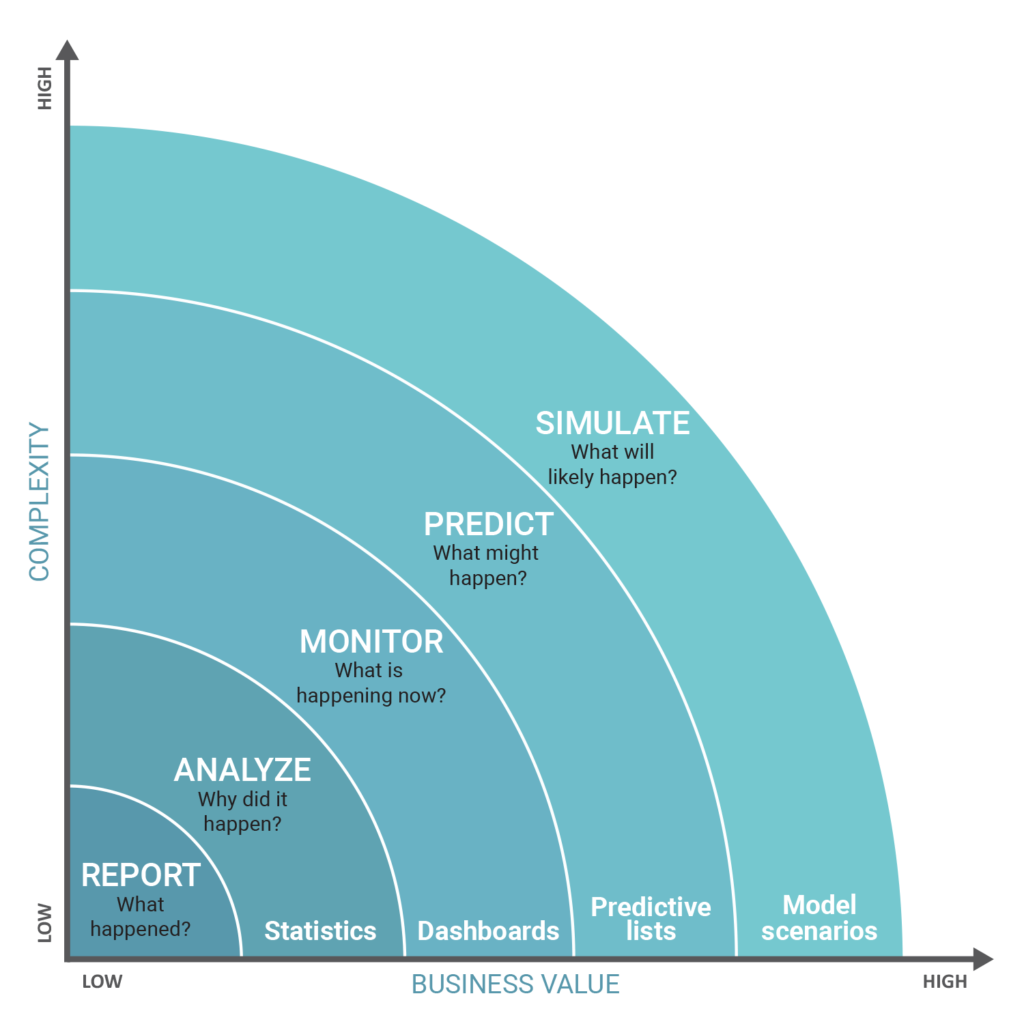
Source: www.predictivelayer.com
As one can see, the most complex type of analysis, predictive analytics, drives the greatest value for clients. This chart alone presents a range of topics too complex for most PhD theses, but it fundamentally distills down to the first principle that data has value. Not all data is created equal or is equally relevant to a given business situation, but with the right methods, one can extract value from data and function as an invaluable synthesizer on their team and for the client that they serve.
What follows are some tricks for optimizing the synthesis of data from a practitioner’s point of view.
WORKING WITH COMPLEMENTARY AND INTERDEPENDENT TOOLS, PROGRAMS, AND SYSTEMS
Examples include working with the R programming language, Teradata, and Tableau. R is a fantastic and free statistical computing environment that allows data miners to model and examine data with functions written in R, making it easy to follow the algorithmic choices made. Teradata is a fully scalable relational database management system that is invaluable in tech to the extent that it is used in data warehousing. Finally, Tableau is business intelligence software that allows one to create compelling, shareable visualizations and dashboards. These are particularly effective in client meetings and for presentations to project stakeholders. It has several versions available for a fee, but a free option is available.
REMAINING FLEXIBLE IN THE FUNCTIONS USED TO EXPLAIN A RELATIONSHIP BETWEEN VARIABLES
Linear models aren’t always the best fit. There are some other models that one should be familiar with in order to adapt to different situations, and these include but aren’t limited to logistic functions, exponential functions, and power functions. Logistic functions show exponential growth followed by the cessation of growth. Exponential functions show, that for every one-unit change in x, there is a proportionate change in y, and power functions show that a proportionate change in x represents a proportionate change in y.
INCREASING OUR LEVEL OF GRANULARITY
In optimizing the usefulness/synthesis of data, it is important to examine the use of variables to assess the state of the relationship between two variables. The inherent advantage of dynamic analysis through the use of variables is being able to examine a relationship in real-time. A quick example of this is the use of calculated fields in Tableau. By using a parameter to assess the rank of an item in relation to others in a group/set, one can create flexibility in a calculated field. This flexibility has storyboard impacts down the line, because it can allow one to adjust a parameter controls and see changes in data live. This materializes as:
RANK([Adjusted Income],’desc’)<=[Top X]
vs.
RANK([Adjusted Income],’desc’)<=5
Each of the functions and methods discussed have usefulness beyond the scope of this paper, but the value is in remaining flexible in one’s thinking about data problems and multifaceted in the approach to providing insights and conducting analysis. A requisite knowledge of the tools mentioned in this paper is essential to the strong analysis of the impetus behind any business problem.