Insight Paper January 18, 2017
Agile Project Management Using Pivotal Tracker
When and why you need an online Agile Project Management Tool.
One of the tenets of Agile methodologies is “co-location”, meaning the entire team sits together, sharing “User Stories” on paper index cards, and keeping the team’s planned and current work posted on sticky notes on the wall for everyone to collaboratively update. Team members are from both the development and business customer sides, and business customers are the only people who can officially declare a newly-developed feature “complete”.
Often, however, this approach is not possible since the team is working from several different locations hundreds of miles apart. In these cases, it’s critical to have some sort of tool to help the team communicate, track status, and plan the work. Some popular options include Agile Bench, Rally and ActiveCollab. This paper however, will be discussing the benefits and capabilities of one specifically: Pivotal Tracker.
Agile Keyword Definitions
- Iteration: Development phase cycles used in Agile Project Management (usually one to four weeks)
- User Story: Action tasks that will be added to Iterations and completed at some point in the project
- Backlog: A prioritized list of User Stories that will be completed during a given Iteration
- Icebox: A prioritized list of User Stories that will be completed at a later Iteration
- Iteration Settings: Determines the Iteration start/end date, the Iteration length, the Point scale, and the initial Project Velocity
- Project Velocity: The average number of Points completed per Iteration (usually an average of three Iterations)
- User Story Points: Point value given to each feature (type of User Story) based on its complexity and expected effort needed to complete
Agile project management software enables the project team to manage a project via an online application. With constant communication among the team through email notifications, application dialogues, real time project status updates, action trackers (backlog) for each iteration, and real time analytical graphs, the project team can ensure everyone is always on the same page.
Example of an email notification

Using Pivotal Tracker, team members can add stories to the backlog, choose stories from the backlog or icebox to add to each iteration, select their desired iteration settings, add point values to specific stories, and determine their project’s velocity through an intuitive, one screen user interface. With the ability to add users with different roles in each project, managers can restrict specific team member’s rights and capabilities within the project.
Why Pivotal Tracker and Not Rally?
As mentioned above, there are numerous options when it comes to this software each with their own pros and cons. I chose Pivotal Tracker because it was extremely intuitive and easy to teach yourself. In a case where the project team is not in the same geographical location and you have users or clients that are not familiar with Agile or Agile project management software, it wouldn’t be a huge investment to demo or teach. With its one- page user interface and free training tutorials, it could be of value in a short period of time.
A Tour Through Pivotal Tracker’s Capabilities
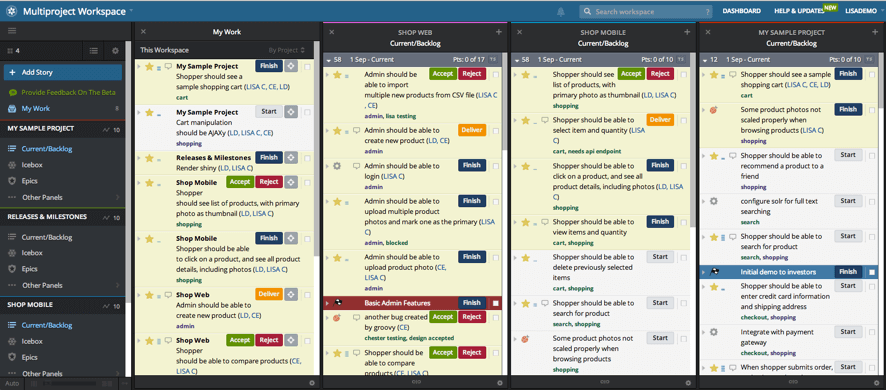
In a Pivotal Tracker workspace, users can “search across multiple projects, view project backlogs side-by-side, and plan with the big picture in mind.”

The navigation menu on the left allows users to select their display settings. Notice how My Work, My Sample Project – Current/Backlog, and Shop Mobile – Current/Backlog are highlighted in blue, meaning those specific columns will be the only ones displayed on the screen. Within each column are Stories, or specific tasks, that must be completed in a given iteration.
There are four different types of Stories: Feature, Bug, Chore, and a Release.
- Feature: A Story that includes end-user functionality and needs approval to complete
- Bug: Includes a defect in the development phase
- Chore: Backend action or development required
- Release: Used in a “Go-Live” situation
Creating a Story
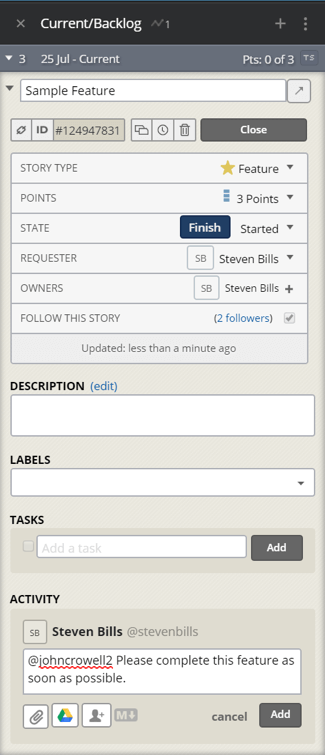
When it’s time to start using Pivotal Tracker, one of the first and most common things you’ll do is enter a story, since those will make up most of what goes on in your project. Let’s take a look:
- The project manager can select the “+” sign to the right of their column of choice (Current/Backlog or Icebox).
- Enter in the Story Title.
- Select the Story Type (Feature, Bug, Chore, or Release).
- Select the number of Points (for a Feature only).
- Select a Requester, the user who requested the story creation.
- Select the Owner(s), user(s) who will own the action of completing the story.
- Enter a Story Description.
- Select a Story Label, users can categorize specific stories into buckets to keep the Current/Backlog and Icebox organized (Label all stories to be completed by members of the project team).
- Select Tasks, this shows individual action items needed to complete the story.
- Activity, this shows any updates on the progression of the story. Tagging individuals included on the project will send an email notification to the individual about the updated activity.
- Users can also perform other actions by clicking the Attach File from your computer, Attach File from Google Drive and mention person in comment in the lower left corner of the Current/Backlog pane.

Project Navigation Bar
Once you’ve entered the first round of stories, chores, and so on, you can get a holistic picture of a specific project and view its Current/Backlog, Icebox, and other columns.

MY WORK
If you want to see work assigned to you rather than the all the work for everyone on the team, select the My Work link.
CURRENT
Selecting the Current link, not surprisingly, brings up all Stories planned for completion in the current iteration.
BACKLOG
Users can keep the Current and Backlog columns separated or they can merge into one. If separated, it’s useful to have all “In-process” stories in the Current and all the “Not-started” stories that will be completed in the current iteration in the Backlog.
ICEBOX
If a story is to be completed at a later iteration or is a potential actionable item, add it to the Icebox and drag it over to the Current/Backlog when it should be completed. Selecting the Icebox link allows users to manage and add stories to this column as well as keep the Current/Backlog clean and efficient.
DONE
To view all stories that have the Finished status, select the Done link. This is a good way to show success to the project team as this column becomes larger.
EPICS
If a Feature is too large for one story, create an Epic, add your stories to the Epic and manage the status of each story under the epic column.
LABELS
To view all Labels tagged in stories, select its link and within the column you can see associated stories for each label.
CHARTS
Selecting the Charts link allows users to view graphs such as the iteration velocity below or a burndown chart of points or stories.
Iteration Velocity
The project’s average completed points per iteration is called its Iteration Velocity. Use this to constrain the amount of work the team can sign up for in a new iteration, on the assumption that past performance is a reasonable estimate for future performance. Three iterations worth of data gives us a good basis to make an estimate for the next iteration’s velocity.

The Feature Approval Process
When stories are finished by their owners, they’re not considered truly complete until approved by the customer. In Pivotal Tracker, the story owner can complete the feature and have the customer give their approval to ultimately send the story to the Done column.
1) The story owner can Start the story while it’s in the Current/Backlog.

2) Then they perform the tasks needed to complete the story and select Finish.

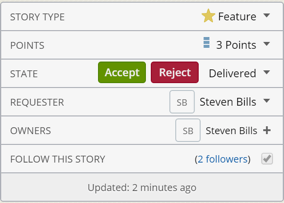
3) They select Deliver to have the Feature Accepted/Rejected (usually by the product manager or other business customer).

4) If the story is Accepted, it will be considered Complete.

5) If the story is Rejected, it will have to be Restarted, Finished, Delivered, and Accepted.


Communicating Project Status
The Analytics section allows project team members to view reports on the Project, each Iteration, Epics, Releases & Burndowns, Story Activity, and Cycle Time.

PROJECT
To get a quick overview of project story trends such as Stories Accepted in the current iteration or the Rejection Rate of features approved or not approved, select the Project Trends link.
BURNUP
Select the Burnup link to measure the project progression in terms of the number scoped points compared to the number of points accepted each day.
CUMULATIVE FLOW
Analyze project trends and determine the number of points that were accepted, rejected, started, not started, delivered, and finished each day using the Cumulative Flow section.
**Note: Only features can have an associated point value (leading to an average velocity); bugs, chores, and releases will always be listed as Unestimated.
ITERATION
The Iteration report link displays an iteration burnup progression for the point scope or the story state flow (similar to cumulative flow). Filter on each iteration and choose either display by number of points or stories depending on preference.
EPICS
Select the Epics link to attain visibility on your epics’ points or story progression as well as what has been accepted, in-progress, not started, or completed.
RELEASES & BURNDOWNS
The Releases & Burndowns section refers to only features and displays a summary report of total release points, points remaining, scheduled, and an estimated completion date.
STORY ACTIVITY
Any activity that is done within a story will be recorded in the Story Activity report. For example, if a story is started, it will be listed in this report with the time it occurred. Users can filter on the type of story, the iteration, or specific dates.
CYCLE TIME
Track the median number of hours worked on stories or the Cycle Time (the time from the story’s start date to when it is accepted) by state, story type, or points in the Cycle Time section.
Pivotal Tracker User Roles
In Pivotal Tracker, there are three different Roles: An Owner, Member, and Viewer. To be added to the project, the Owner must enter the new user’s email address, choose their role, and select add. The Owner will be prompted to add the new user’s full name as well. Once the user is added, they will receive an email notification from Pivotal Tracker.

MEMBERS
Project Members can create, move, delete, and edit stories, as well as add comments and attachments. Essentially, they can perform any action related to working within the project. It is not possible to restrict the actions a Member can perform within a project; however, they cannot edit project settings, add or remove project Members, or configure integrations (which are owner-specific actions).
OWNERS
In addition to having the same abilities as project members, project Owners can add or remove members to the project from the project members page, edit project settings, and configure integrations. The Owner or any admin of the account which the project belongs to can also edit project settings, add/remove members, and configure integrations for any project on the account (even those they are not explicitly members of).
VIEWERS
Viewers are read-only members and can’t make any changes or follow stories. You can have as many Viewers as you like, as they do not count against plan limits on the number of collaborators.
Is Pivotal Tracker the Right Agile PM Software for You?
Overall, Agile project management software is a fantastic way to track projects, communicate with team members, and ensure all objectives are completed on time. As mentioned above, it’s extremely valuable with co-located teams to establish a centralized environment for the project team to reference and update as the project progresses. Regardless of the tool, leveraging project organization capabilities can be extremely beneficial for the team. However, the highly-intuitive, easy-to-learn user interface remains the main selling point for Pivotal Tracker.
For more information, please check out www.pivotaltracker.com.
